
Last year we published our list of the top KPIs for delivery fleets to track in 2026. It covered the fundamentals for delivery operations optimization, including utilization, on-time delivery, cost per distance, downtime and emissions. Over the year though, we've kept track of which KPIs have continued to show up in conversations, which new ones have entered, and which have been deprioritized.
Fewer people ask "how many kilometers can you save us?" and more ask "where is our time going?", "how much of the plan do we have to fix by hand?" and "can we trust the numbers?"
Here's what we found, and the KPIs we expect to define 2027.
3 big changes in 2026
- Time became more talked about than distance
Driver hours, time windows, dock time, waiting time, and shift length were some of the specific measures of time spoken about the most. When drivers are paid by the hour, or carriers charge for waiting, a shorter route that sits in a queue isn't a cheaper one.
- Fleets want to measure manual work
Planner time and the number of manual edits to routes output by software came up in almost 1 in 5 conversations throughout the year.
- Sustainability has been a hot topic for years, but now it's getting real
Emissions and electrification were among the most-discussed topics all year. Early in the year, conversations were about EV range and pilots. By the second half, they were about emissions per delivery, total cost of ownership and charging infrastructure decisions that sit on a balance sheet.
The 9 key KPIs for 2027
1. Time-based cost to serve
Cost per kilometer is a useful number, but it misses how many fleets actually accumulate costs. Owner-drivers, contractors, and carriers are often paid on a mix of hourly rates, per-kilometer rates, per-drop fees and waiting charges. In that model, a route's cost is driven as much by its duration as by its length.
For 2027, track cost to serve per stop, per customer and per lane, built from both time and distance:
Formula: (Driver or carrier time cost + distance cost + fixed and accessorial charges) / deliveries
Break it down by customer and you'll often find a small number of sites with long unloading times or narrow windows costing far more than their volume suggests. That's the starting point for better pricing, delivery-day changes, or service agreements.

2. Waiting time and dock time
This was the KPI we heard about most often that almost nobody was measuring well. Waiting at customer sites, queuing at the depot and loading delays are often invisible in route reports, because they don't show up as kilometers.
Yet in one network consolidation we analyzed this year, dock time took up more than half of the drivers' working day, and it explained cost differences between sites better than distance did. In another, fixed early start times meant vehicles were routinely waiting for customer sites to open.
Track separately:
- Dock time: from arrival at the DC to departure, including loading
- On-site waiting time: time at customer sites before unloading starts
- Service time: the time actually spent unloading and completing the delivery
Keep a cap on service time assumptions in your planning, too. An inflated per-stop service time makes every route look full when it isn't.
3. Planner rework rate
If your team edits every route the system produces, you're paying for optimization twice. In 2026, we regularly heard about schedulers spending hours each day building or correcting routes by hand, and about planning knowledge that lived in one or two people's heads.
Measure it directly:
- Manual edits per plan: stops moved, routes split or merged after the plan is generated
- Automated routing success rate: the share of jobs routed without manual intervention
- Planning time per day: hours from data ready to routes released
If planners keep making the same change, it usually means a real-world rule (a site access restriction, a customer preference, a loading sequence) is missing from the model. Capturing those edits as feedback is how planning systems improve.
4. Workload balance and driver compliance
Driver shortages haven't gone away, and fatigue, break, and shift rules are getting more scrutiny. We saw at least one routing decision this year come down to how well a system handled multi-shift work and fatigue rules, rather than raw efficiency.
For 2027, look beyond average hours per driver and track the spread:
- Variance in hours and stops across drivers and routes
- Break compliance and shifts that exceed planned duration
- Overtime hours as a share of total hours
A plan that saves 5% on paper but leaves three drivers on 12-hour days isn't a better plan.
5. Fleet size versus reliability
Vehicle count reduction is still one of the first things operators ask about. What changed this year was a more careful view of the trade-off. In more than one project, an aggressive cut to the number of vehicles looked best in the model but would have increased manual re-routing on busy days. The conservative option, with slightly fewer savings, was the one operators chose.
Pair vehicle count with a reliability measure, such as the share of days the plan is delivered without adding vehicles or re-routing. The right fleet size is the one that holds up on a normal bad day.
6. Emissions per delivery
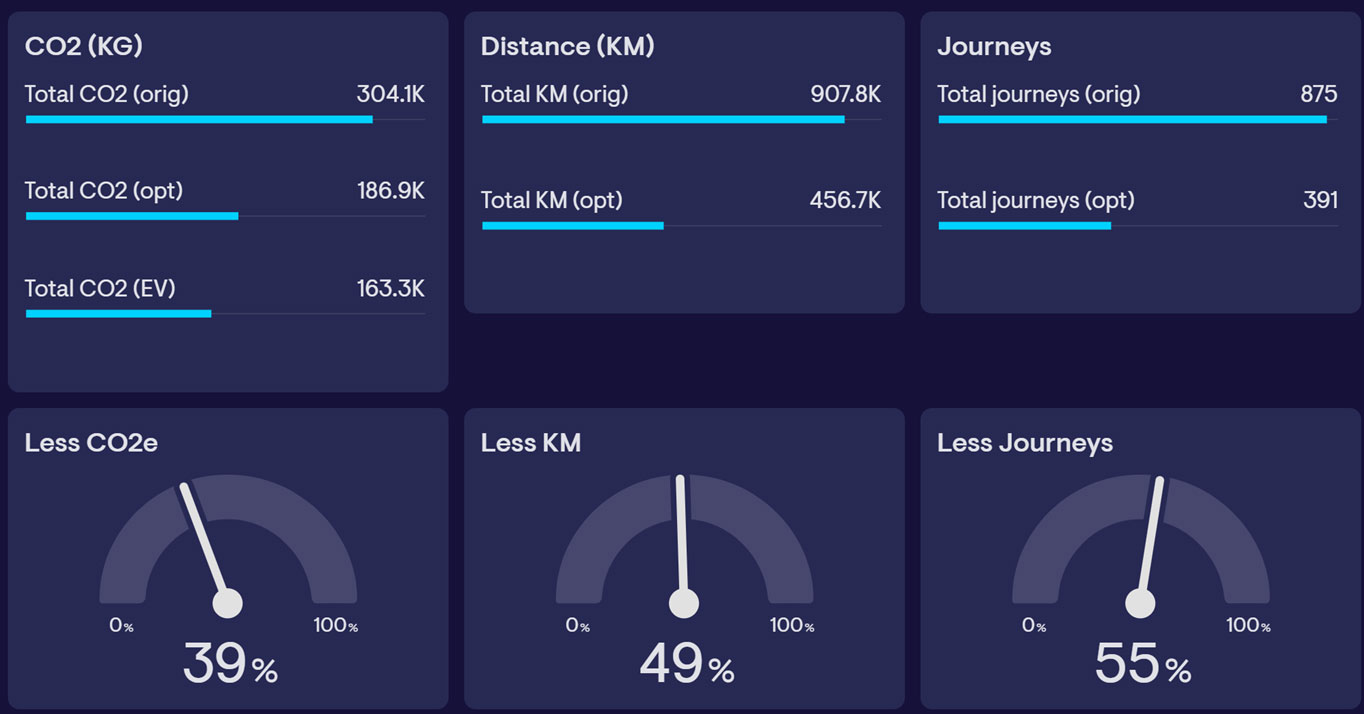
Total fleet emissions are useful for reporting. Emissions per delivery, per customer and per kilometer are useful for decisions. As more shippers ask carriers for Scope 3 data, being able to report emissions by customer becomes a commercial advantage, not just a compliance task.
Fleets planning electrification should add:
- Energy use per route, accounting for payload, gradient and temperature
- Share of routes that are EV-feasible today without mid-route charging
- Charging demand per depot, to right-size infrastructure before grid connection requests go in
7. Visit frequency and spacing
For fleets with recurring deliveries, such as food service, beverages, consumables and waste collection, how often you visit a customer can matter more than the route on any given day. We spoke to several operators this year whose biggest savings came from changing delivery days, not routes.
Track visits per customer per week against what each customer actually needs, and the spacing between visits. Customers receiving more visits than their volume justifies, especially in outlying areas, are a common source of cost.
8. ETA accuracy and on-time within the window
On-time delivery is still essential, but customers now expect accurate ETAs, not just arrival within a broad window. Measure:
- On-time delivery within the committed window (for example, one hour)
- ETA accuracy: the gap between the predicted and actual arrival time
- Late-delivery notifications sent before, not after, the window is missed
Poor location data is one of the most common causes of bad ETAs, which brings us to the last KPI.
9. Data quality and plan-versus-actual accuracy
In 2026, more operators asked us how accurate a model was against what really happened, and what percentage of their addresses could be located confidently.
Two metrics to add:
- Geocode confidence rate: the share of delivery addresses located with high confidence. Low-confidence addresses should be flagged for review, not routed automatically.
- Plan-versus-actual variance: the gap between planned and actual distance, duration and stop sequence. If your plans are consistently far from reality, the problem is the inputs, not the drivers.
What's dropping down the list
None of the 2026 KPIs have become irrelevant, but some work better as supporting metrics than headline numbers:
- Total kilometers on its own, without time and cost
- Average utilization without a view of peak days and reliability
- Stops per route without reporting by kilograms, pallets or jobs, which better reflect how mixed-freight fleets actually fill up
How to update your dashboard for 2027
You don't need to track everything. Pick three to five KPIs from this list that tie back to your biggest cost or service problem, then:
- Load a few stable weeks of historical routes and check them against what your team knows actually happened
- Make sure your data captures arrival, start of service and departure for each stop
- Log edits to the plan. They're both a cost and a to-do list for improving your rules
- Look at cost, reliability, workload and emissions side by side, so an improvement in one doesn't hide a problem in another

Using Adiona to track and improve your 2027 KPIs
Adiona's FlexOps route optimization plans around real time windows, service times, shifts and costs, and reports by jobs, weight and pallets as well as stops. The Fleet Simulator lets you test fleet size, depot, delivery-day and electrification scenarios before you commit, and EmissionSense measures emissions per delivery and per customer for reporting.
Try Adiona free for 14 days and see where your time is really going.