The challenge
A less-than-truckload (LTL) freight 3PL runs a two-wave operation consisting of a delivery wave and a separate pickup wave. Each wave departs from one of two depots, and the 3PL services a major Australian metro region.
The set runs underpinning the delivery wave were set up and unchanged for years. As the business grew, driver deployment and vehicle utilisation drifted further from actual demand, and the run structure stopped reflecting how the network actually worked.
On the other hand, the pickup wave had never had a formal set run structure at all. Drivers worked from a loose, manually managed list.
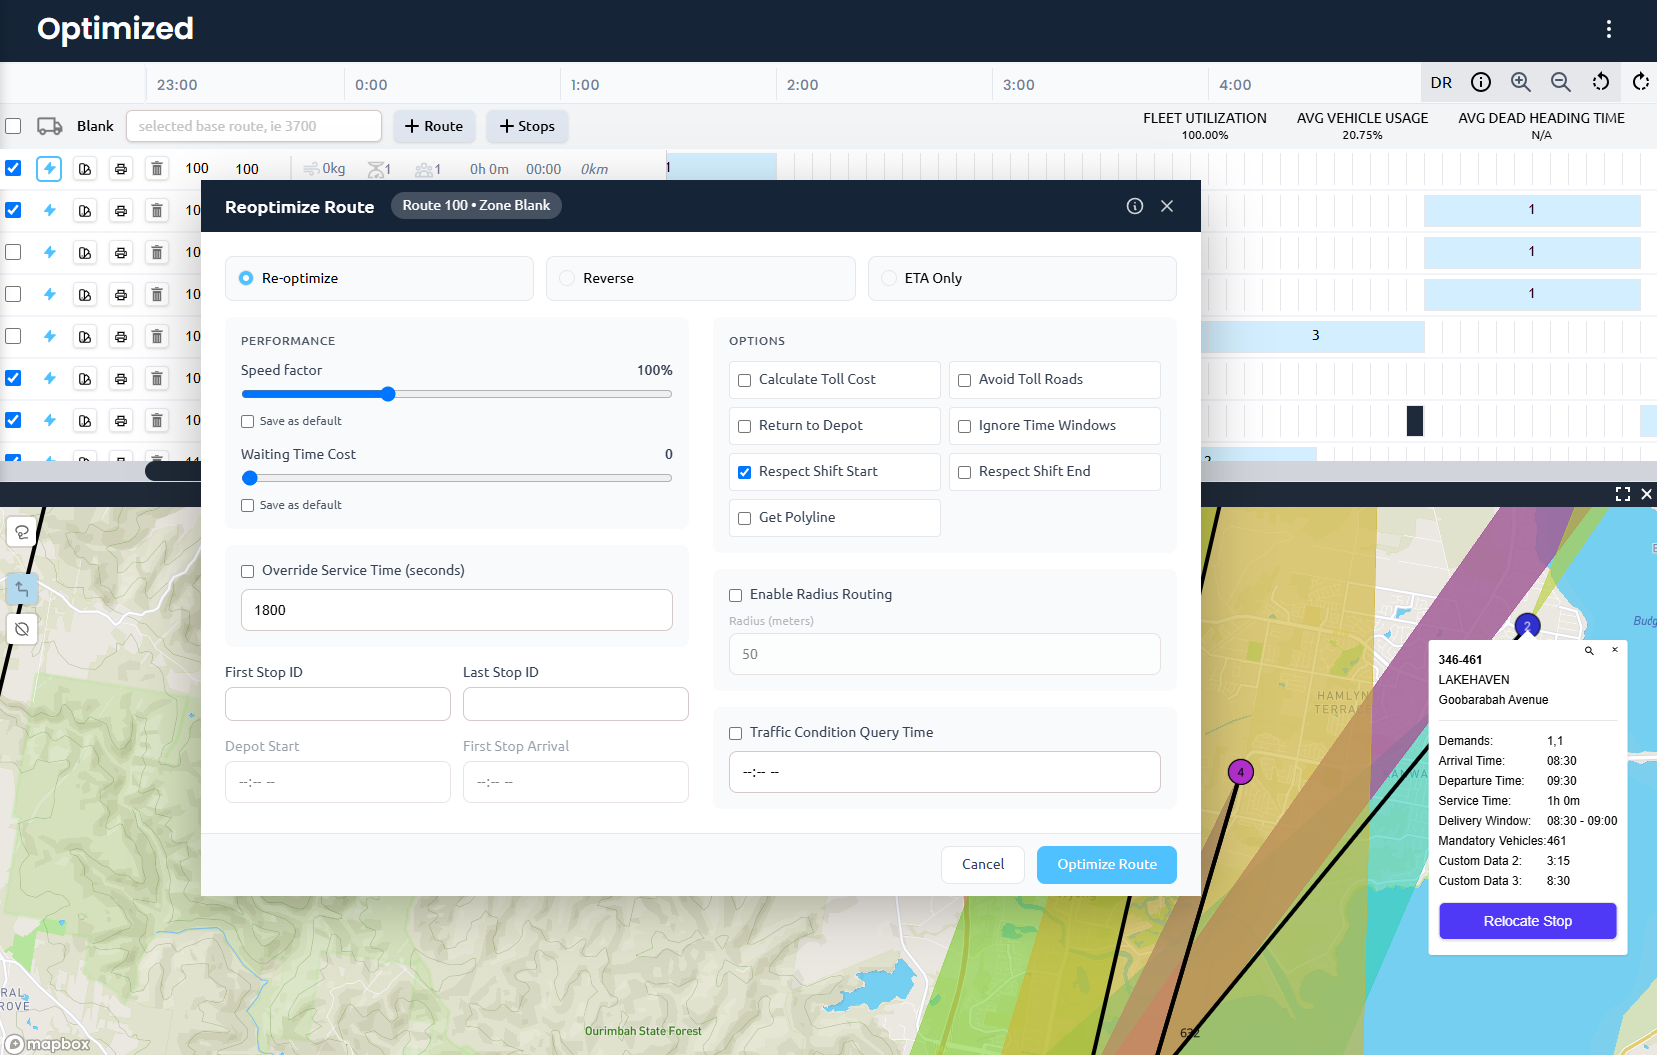
This 3PL was already using Adiona’s FlexOps platform to sequence stops within each existing run, and came to the Adiona team to ask about how to take it to the next level and rethink the structure of the runs themselves, not just the stops.
Using more than two waves?
The same approach undertaken in this case study will apply whether an operation runs two waves, three, or a single continuous shift. Adiona FlexOps optimizes according to your existing assets and doesn't require you to add more.
Redesigning, not daily re-routing
The cheapest theoretical approach would be to recalculate every route from scratch each day, so why not do that?
Daily re-routing breaks the geographic consistency that lets drivers build relationships with regular customers, something the client flagged as core to service quality. Instead, the team designed stable, repeatable set runs, sized with deliberate headroom in both driver count and vehicle capacity, so the new structure can absorb near-term growth without a fresh redesign.
Adiona’s process
Adiona worked with the in-house routing team to:
🚚 Consolidate raw data into stops
Grouping same-location jobs and modelling realistic service times based on item counts.
🚚 Benchmark theoretical minimums
Using FlexOps vehicle routing engine across several of the client’s busines recorded days to find the lower bound on route count.
🚚 Design against a full week, not a single day
Visit frequency varies stop by stop, but total weekly volume holds steady, so runs are sized around weekly demand.
🚚 Apply LLM-assisted tooling and custom scripts
Node.js, TypeScript scripts, and LLM-assisted tools clean, aggregated, and reshape the data into a format compatible with FlexOps .
🚚 Manually refine run boundaries
Using FlexOps map interface to separate high-volume stops that were algorithmically grouped.
🚚 Stress-test against the busiest week on record
Verifying every proposed run before sign-off, under peak, real-world conditions.
🚚 Allocate to the nearest depot
Balancing the loading dock throughput across both depots while minimising dead-leg travel.
The results
Wave one: From 60 runs to 23
63% fewer set runs than the existing structure, while maintaining service levels and required time windows. The two busiest days were measured to verify that the new structure cut total driving distance by 62% and total driving time by 56% for the same volume of stops, items, and billable weight.
The only trade off was a modest extension to the wave’s finish time, for a small number of longer routes at the outer edge of the network.
Wave two: Built from a standing start
Prior to the project, there were zero set run structures for the pickup wave. With Adiona, the customer established 30 run structures, with pickups clustered by location and weekly volume, then manually refined to account for real-world constraints and requirements.
The result was consistent with the theoretical minimum already benchmarked for that wave.
Future-proofing for change
The 3PL now has a documented, reproducible methodology to redesign set runs as needed, whether for additional waves, expanded territories, or for changing customer needs.Once the new structure is running and generating fresh route performance data, the next opportunity is dynamic day-to-day adjustment, automatically merging light adjacent runs or shifting overflow load between them.
