
Learn what many TCO Calculators get wrong and how accurate TCO calculations can optimize ROI throughout your transition
Are you correctly assessing the Total Cost of Ownership (TCO) for your delivery fleet?
Many logistics professionals are using outmoded TCO calculators that don’t accurately account for labor costs during Zero Emissions Vehicles (ZEV) transitions, since labor is significantly tied to delivery network design and vehicle routing. Companies making the transition typically use averages or historical telematics data, but these inputs are often deeply flawed and don’t match their real customer-driven fleet requirements throughout the year.
The North American Council for Freight Efficiency (NACFE) identifies TCO components of a Class 8 Battery Electric Vehicle (BEV), from highest to lowest, as:
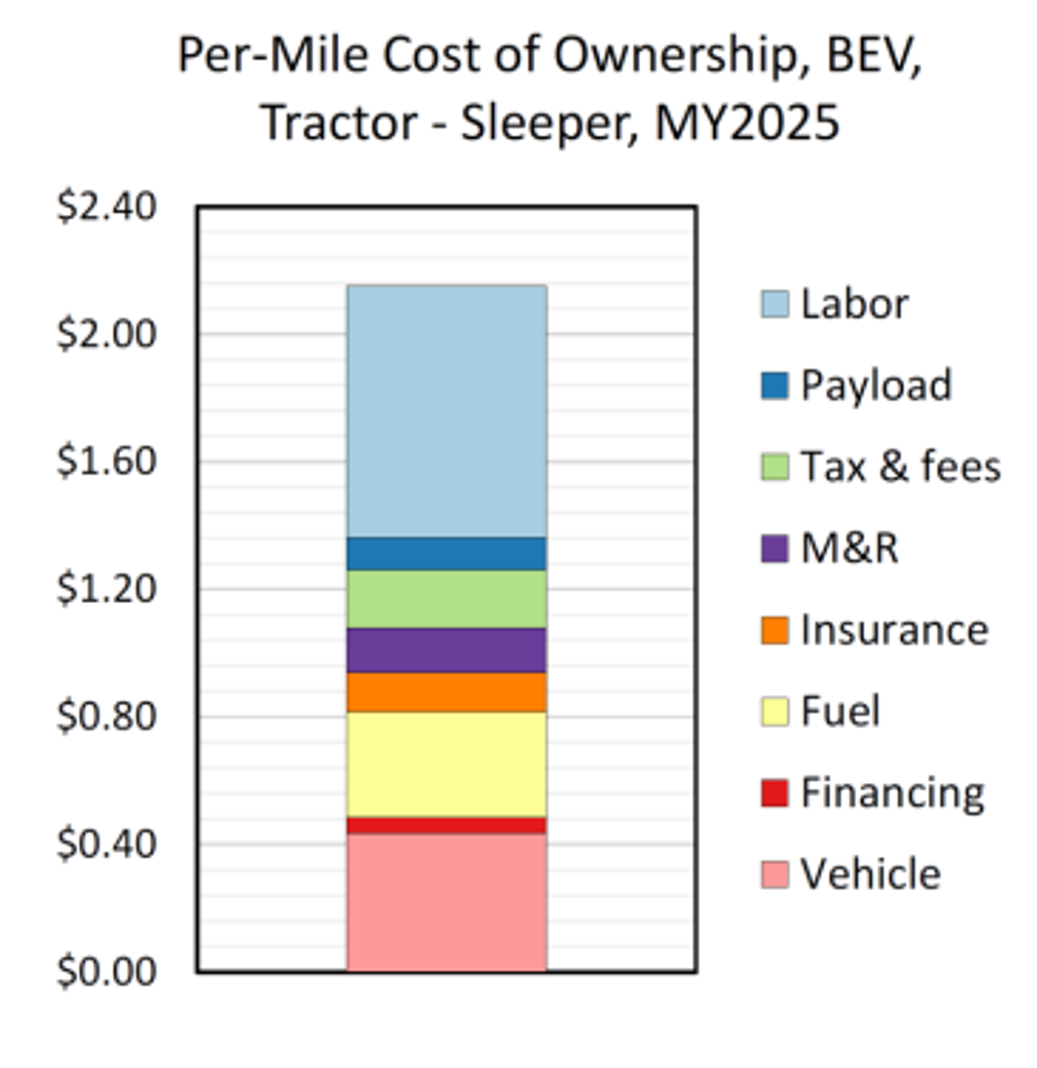
This makes sense—labor is a major factor in TCO—but again, many logistics professionals miscalculate labor, throwing off the entire equation. Here’s why that happens.
EXAMPLE: Modified Labor Requirements for ICEs and BEVs
A company has 10,000 miles of deliveries from a DC, which requires 10 x 1,000-mile rig routes. If they swap 5 BEVs with only a 500-mile range each, they need more break and charging time, and they’ll potentially need more driver shifts.
Modified Labor Requirements: The new arrangement requires more break and charging time, and it might require more driver shifts. That could mean that 10 full-time driver shifts in diesel would now require 12-15 driver shifts with a mix of ICEs and BEVs. The company’s approach to route optimization will then play a key role in reducing labor costs and the overall TCO.
This example illustrates the complexity of transitioning from ICEs to ZEVs. When doing so, it’s absolutely vital to ask the right questions and identify an accurate TCO throughout every stage of your transition.
Accurately assessing your TCO and maximizing ROI means asking yourself:
- What is your optimal mix of ICE and ZEVs for the lowest TCO today?
- What is the optimal mix in a year, in 5 years, and in 10 years that achieves the minimum TCO and achieves your Net Zero goals?
- What Capex and Opex budgets are required to achieve it?
In addition to vehicle and infrastructure Capex and Opex, it's critical to look at the reduced range of the vehicles and their impact on routing and labor costs dynamically throughout various time periods. This can be done by combining dynamic route optimization and network planning with TCO inputs and performing higher-level optimizations. Ultimately, this will help you decide where and when ZEVs can be substituted into your network.
The following case study outlines an Adiona client’s experience optimizing TCO as they transitioned from Class 8 diesel vehicles to a mix of Fuel Cell Vehicles (FCV) and Battery Electric Vehicles (BEV) to achieve their Net Zero goals.
Note: In this article, we'll be ignoring some of the other TCO components that are well covered in articles like this one from 7Gen and this great Youtube video. And to learn more about the opportunities and challenges of Class 8 ZEV transitions, check out this article by Logisyn Advisors.
Case Study: Calculating optimal delivery routes and reducing labor costs on the road to Net Zero emissions
One Adiona customer, a large retailer, took the total customer demand of their delivery network from one distribution center across an entire year and calculated the optimal delivery route requirements using real traffic and other inputs. They then simulated that network with different ZEV mixes to determine the optimal fleet makeup, achieving the lowest possible TCO with minimal implementation headaches.
Route planning guided by Machine Learning (ML)
Adiona's rapid ML-powered delivery routing platform performed hundreds of simulations quickly, then processed higher-level optimization algorithms to choose the ideal (lowest) TCO scenarios. This was done over short (1-year) and long (10-year) horizons so the organization could "begin with the end in mind," planning their POC phase with clear goals and KPIs.
This large retail customer is transitioning from Class 8 diesel vehicles to a mix of Fuel Cell Vehicles (FCV) and Battery Electric Vehicles (BEV) to achieve their Net Zero goals. FCVs are more expensive up front and the refueling infrastructure is more expensive, but they achieve significantly longer range than BEVs. So we start by looking for the low-hanging fruit and determining which delivery routes can accommodate each vehicle type with today's operational requirements (e.g., customer demands, time windows, replenishment templates, order patterns, seasonality). It’s equally vital to explore how that might change over time.
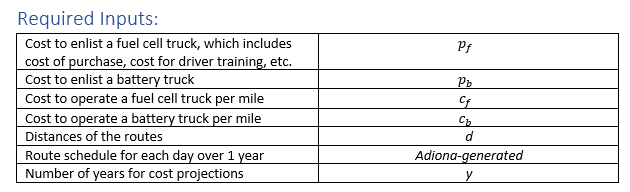
The Inputs
Adiona's tool requires at a minimum: The up-front vehicle costs for each type, which may include the purchase price and any technology-specific costs such as driver top-up training. It also takes in the per-mile cost of each vehicle, the route distances, the route schedules calculated over at least a historical year, and the projection length in months or years.
On top of that, it’s easy to add in other costs for infrastructure as flat costs or those included in the per-mile cost, such as fuel rates.
The Outputs
The TCO Optimization tool will then calculate the optimal mix of vehicle types, which may include both the target vehicles as well as legacy vehicles—if the constraints for using a newer target vehicle can't be met at the optimal cost.
The output will look like this:
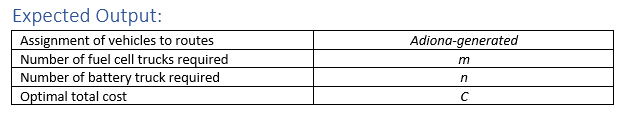
Note: The outputs will include other parameters and can be run at scale to cover many different scenarios.
With these scenarios in hand, and the costs calculated for fuel and maintenance from traditional analyses, a few different visualizations were created.
Results
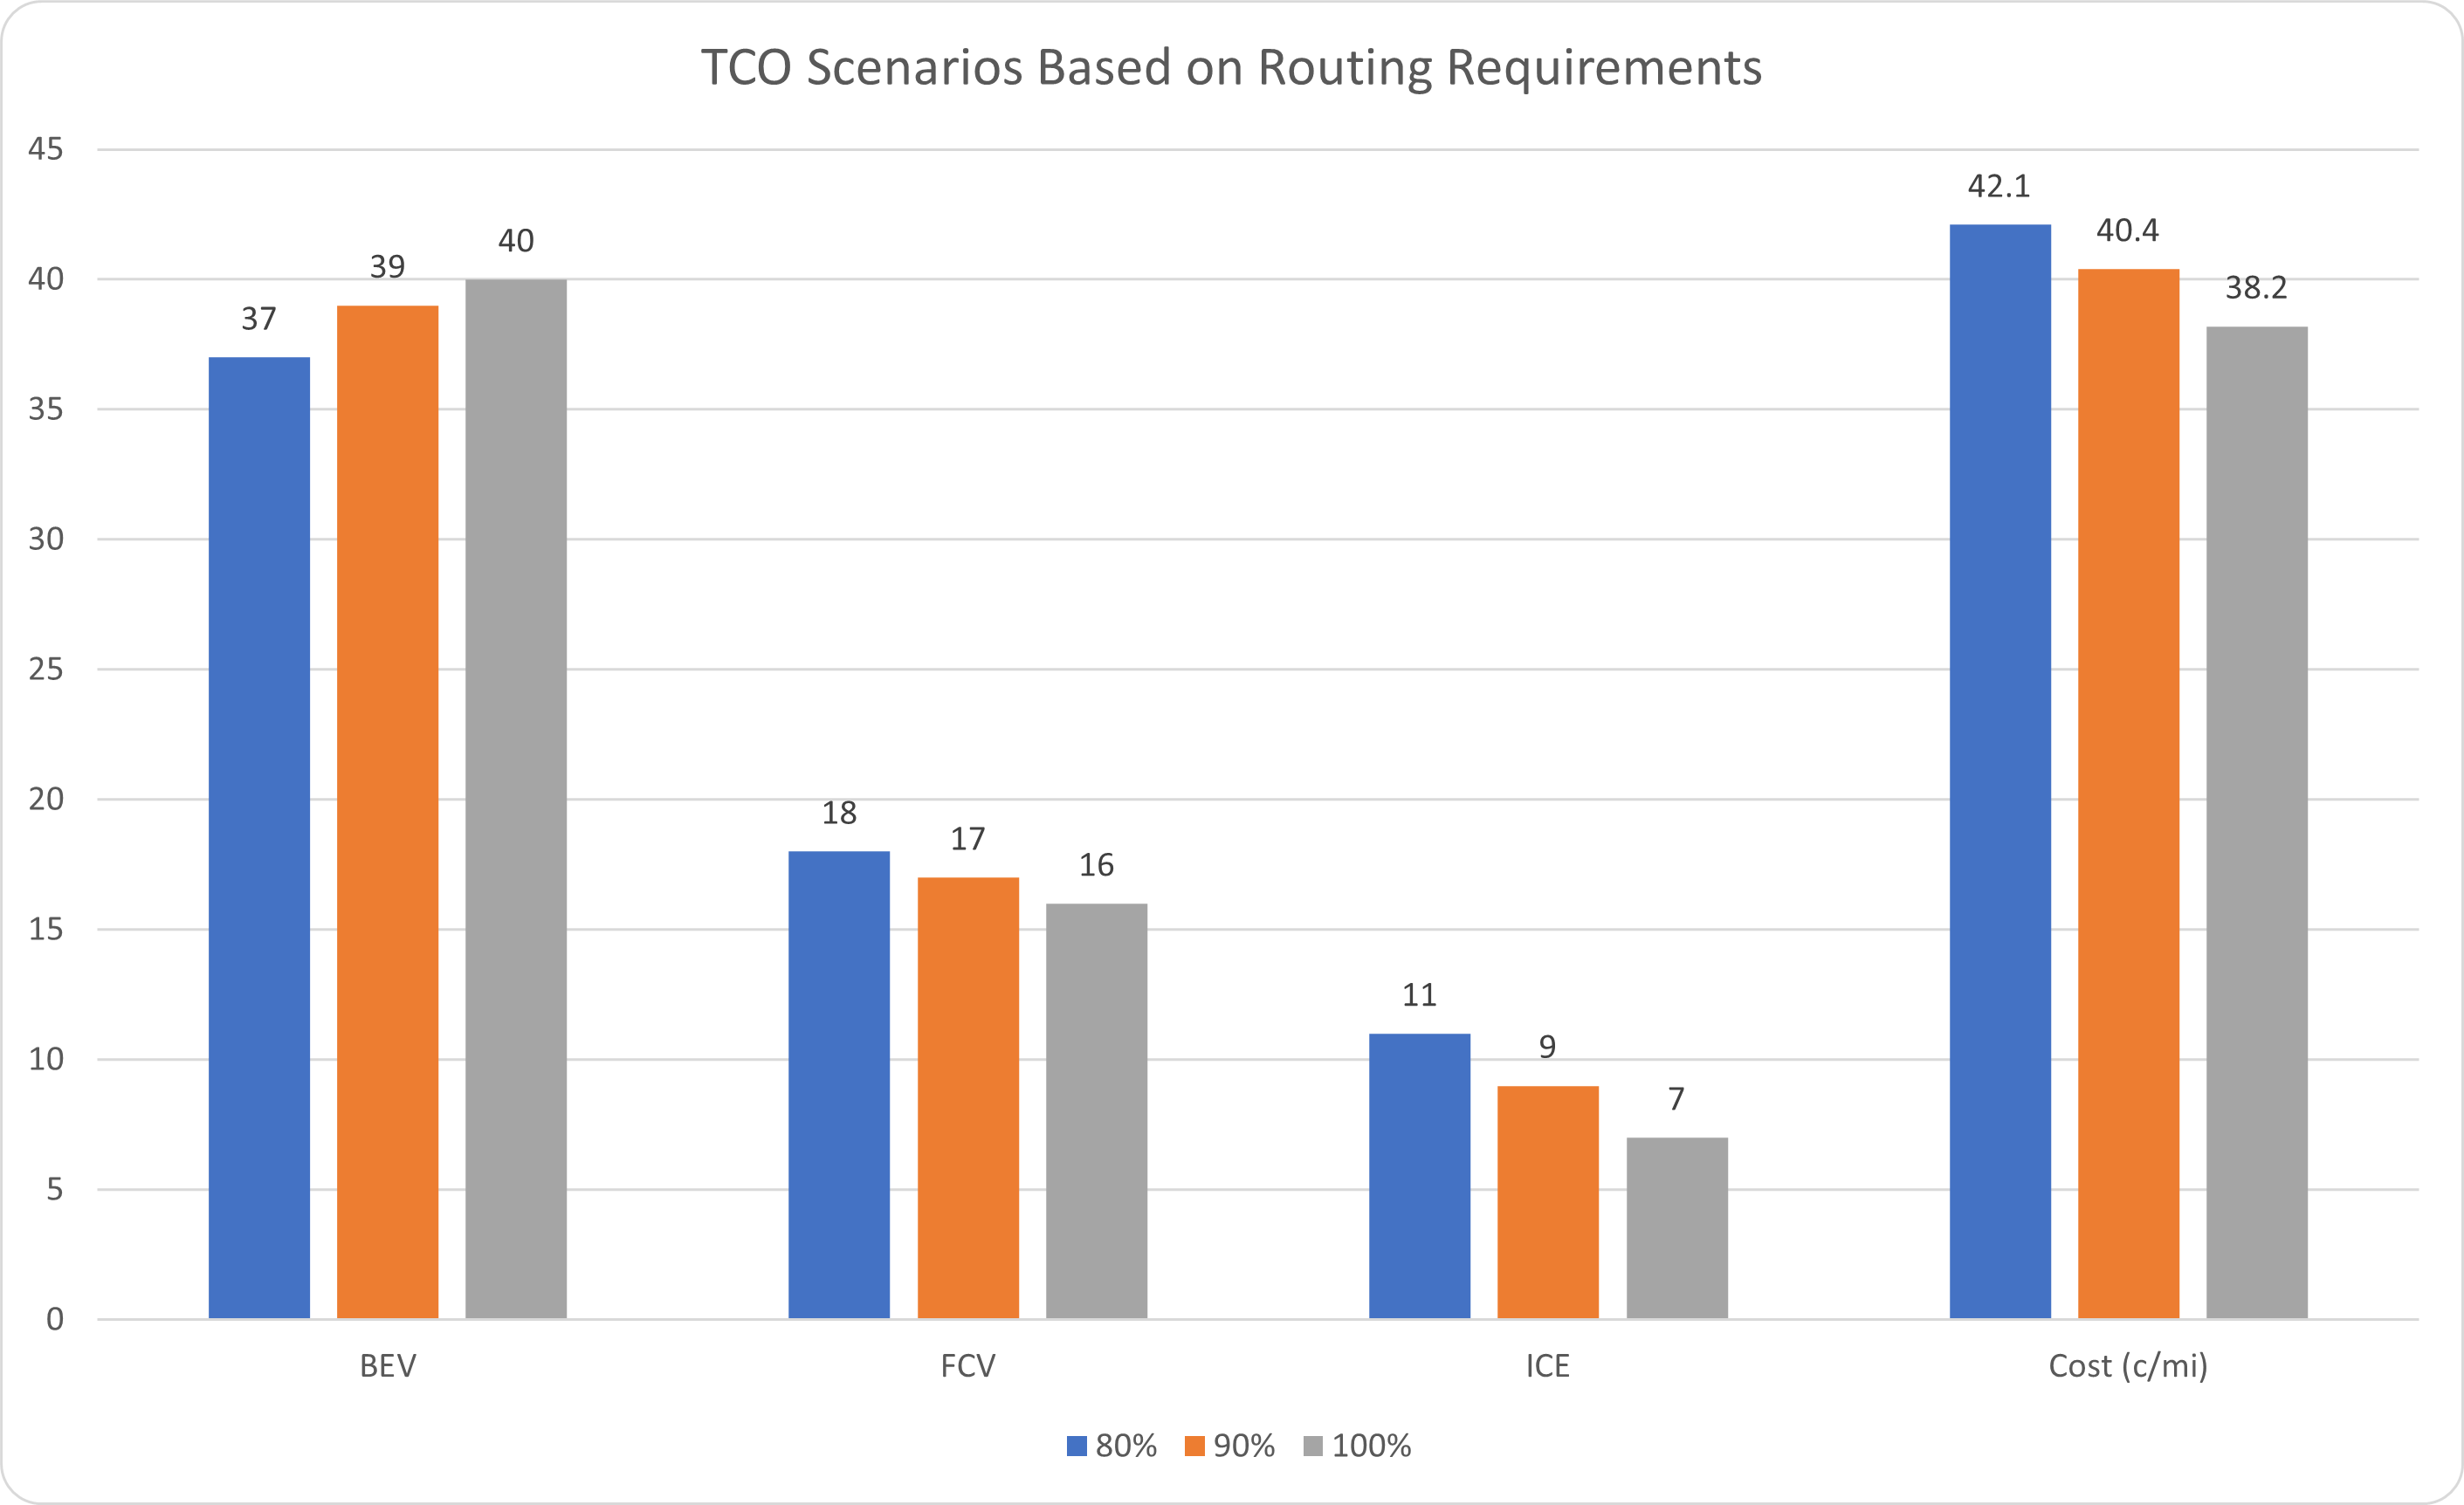
Here is a comparison of three scenarios of TCO per mile and the relevant vehicle type mix ensuring that all delivery routing requirements are achievable in a territory with a single DC and over 33,000 miles of delivery routes to cover from this customer's DC.
Explanation
The BEVs have a maximum range of <500mi between charges, so assuming we don't have a charge infrastructure on road yet (because we really don't for Class 8 trucks), we let the routing tell us how many vehicles with that range could possibly be used and still satisfy the operational needs. Likewise, we look at the FCVs with 800-mile range, and the remainder of longer hauls will still have to be ICE. We see that depending on the cash outlay for ZEVs up front, we can optimize the selection of different vehicle mixes and still achieve lower operating costs per mile.
Scenario 1: Lowest TCO, Highest Capex
In a 1-year horizon, the optimal mix for the lowest TCO comprises 40 BEVs, 16 FCVs, and 7 diesel vehicles (ICE).
Scenario 2: Higher TCO, less up-front Capex
If a lower Capex (and reduced operational complexity) is desired, the next-best TCO can be achieved with 39 BEVs, 17 FCVs, and 9 diesel vehicles (ICEs).
Scenario 3: Highest TCO, easiest implementation
Our lowest hanging fruit scenario is 37 BEVs,18 FCVs, and 11 ICEs.
Actionable data and evidence-based results
As you can see, the benefit of this approach is that it provides clear, evidence-based results, and it identifies steps that work in a real network. Unlike Excel-only analyses, optimization-based approaches like this allow for faster Net Zero transition by getting new wheels on the road, at the right times, to suit the real operations.
Ready to perform your own TCO analysis to optimize ROI?
Contact us to discuss how to use our tools for your own TCO analysis.