Your delivery operations, optimized.
Mature your last mile delivery, from depot planning, to fleet right sizing, to route optimization and everything in between.
Build a command centre for your operations
Bring all of your operational data, including telematics, shift times, fleet configuration, customer and delivery information and more, into one place. Adiona optimizes your routes in minutes, reducing costs, fuel consumption, and time on the road, while getting deliveries to customers faster.
Go to the next level of operations with best in class customer experiences, including real-time ETAs, text message notifications, and higher service quality.


Route optimization
For periodic or dynamic routing, everything starts with optimized routes. Adiona’s proprietary algorithms are 10% or more accurate than other solutions on the market, and our software is available on a project by project basis to make getting started easier.
Fleet rightsizing
Whether it’s downsizing, adding more vehicles, or transitioning vehicle types, plan your next step with FlexOps. Improve the utilization of your existing assets and grow your business and customer accounts without needing to outlay high costs to acquire new vehicles.
Emissions measurement
From your existing route and operational data, measure carbon emissions down to the parcel level. Suitable for reporting to customers as their Scope 3 emission, or reporting your own Scope 1 and 2 emissions.
Customer delight
Accurate ETAs, expected delivery notifications, faster turnarounds, and higher service quality are all stops along the journey to highly satisfied customers. Adiona’s accuracy and dynamic updates to routes, even when a driver is already on one, are unbeatable.
See Adiona in action
Take a self-guided tour of our platform, and explore how Adiona works in real-world scenarios.

Powered by continuous machine learning and AI
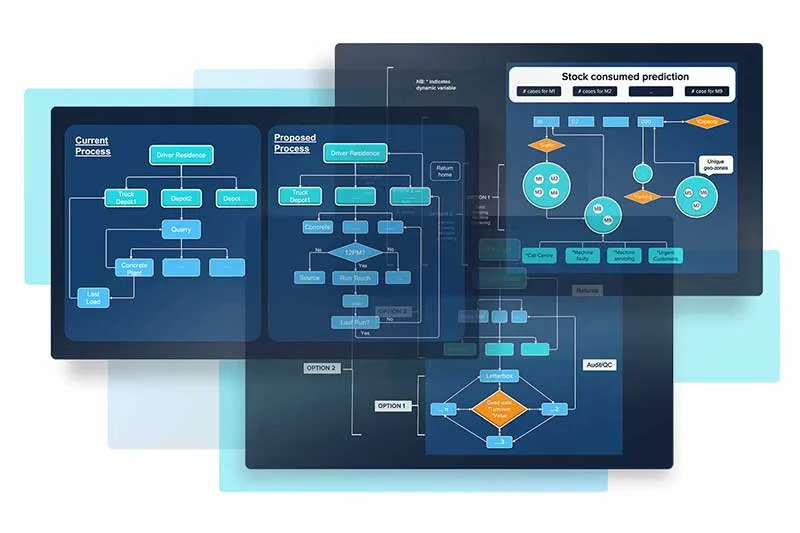
FlexOps continuous machine learning (CML) and AI takes your historical data to re-create your delivery operations and identify opportunities for improvement across processes, costs, routes, delivery capacity, and fleet management.
Maintain human preferences over absolute optimization to prioritise happier drivers.

Built from the ground up for developers
The Adiona RESTful API can be integrated into almost any IT stack. More than just a route optimizer, FlexOps is an organization optimizer. Built to minimize cost and time while prioritizing customer service levels and on-time delivery, it gives you control. Access the latest documentation here and start planning tens of thousands of jobs in just minutes.
View our data and security standards
Learn about how we make data integrations simple and secure.
Automatically identify
Inefficient manual or semi-automated scheduling, booking, or routing practices
Utilization variations across fleets causing instability
Handling steps (sorting, packing, scanning) that are causing delays and bottlenecks
Underperforming prioritizations, FIFO, or vehicle packing processes
Over or under-utilized assets
High-cost reverse logistics processes
Last-mile delays due to parking, traffic, weather, human error, or other.
Here are some examples
Explore our technologies
Fleet Simulator
Conduct extensive scenario planning before committing. Calculate TCO, model purchasing decisions, fleet rightsizing, and depot planning without the risk of real-world repercussions.
EmissionSense
Measure and report on your emissions down to the parcel level to segment carbon emissions by customers and comply with environmental regulation.
Get started today
Access 14 Days of Adiona for free and upload your own data to see how much efficiency you can gain.
—
Developers, get instant access to our API.
